USA
Lexus USA has reported 27,935 total sales for March 2017, a 7.5% decrease over last year — here’s the model-by-model breakdown:
| MONTH | Year to Date (*DSR) | |||||
| 2017 | 2016 | % CHG* | 2017 | 2016 | % CHG* | |
| CT | 841 | 972 | ‐13.5 | 1,692 | 2,356 | ‐28.2 |
| IS | 2,597 | 3,679 | ‐29.4 | 5,704 | 8,818 | ‐35.3 |
| RC | 619 | 1,194 | ‐48.2 | 1,561 | 2,869 | ‐45.6 |
| ES | 4,626 | 5,792 | ‐20.1 | 9,506 | 13,018 | ‐27 |
| GS | 737 | 1,524 | ‐51.6 | 1,695 | 3,989 | ‐57.5 |
| LS | 370 | 469 | ‐21.1 | 944 | 1,240 | ‐23.9 |
| LFA | 0 | 2 | ‐100 | 0 | 5 | ‐100 |
| Total Cars | 9,790 | 13,632 | ‐28.2 | 21,102 | 32,295 | ‐34.7 |
| NX | 5,619 | 4,533 | 24 | 12,097 | 11,375 | 6.3 |
| RX | 9,445 | 9,648 | ‐2.1 | 21,641 | 23,796 | ‐9.1 |
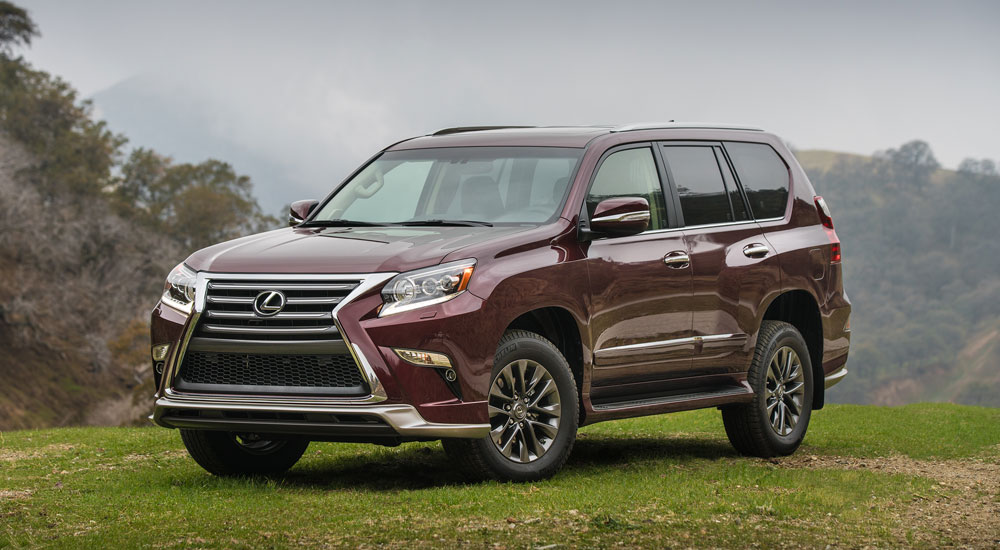
| GX | 2,569 | 1,961 | 31 | 5,514 | 5,219 | 5.7 |
| LX | 512 | 424 | 20.8 | 1,491 | 1,536 | ‐2.9 |
| Total Trucks | 18,145 | 16,566 | 9.5 | 40,743 | 41,926 | ‐2.8 |
| Total Sales | 27,935 | 30,198 | ‐7.5 | 61,845 | 74,221 | ‐16.7 |
Please note, all percentages are calculated by the Daily Sales Rate (DSR), which takes into account the number of days in the month that dealerships could sell cars. March 2017 had 27 selling days, March 2016 had 27 selling days.
Despite a negative end to the month, Lexus sales in the USA have rebounded somewhat after a difficult start to the year. This can be attributed to better SUV availability due to increased inventory, with only the RX seeing a minor drop in sales.
Car sales are now the elephant in the room — there’s simply no way to sugarcoat the freefall that’s happening across the industry.
This post will be updated throughout the day as the German brands release their sales numbers and Canada publishes this month’s sales.
 Best Deals today in www.freepromotoday.com
